The metrics that flatter you

Up and to the right
There is a particular kind of chart that every board deck contains. It counts something cumulative — total sign-ups, total downloads, lifetime users — and it only ever rises, because nothing can be subtracted from it. It is the most reassuring image in business, and it tells you almost nothing.
The chart survives because it is easy to make and pleasant to present. Nobody has to explain a dip, because there are no dips. And over time the number becomes the goal. The team that owns it starts to optimize for it, and the work drifts toward whatever moves the line rather than whatever helps a customer.
Why they seduce
Flattering metrics are not lies. They are true numbers that answer the wrong question. Total sign-ups tells you that marketing is working. It does not tell you whether anyone found the product useful, came back or paid. A team that steers by it will keep buying traffic for a product that is quietly failing.
The problem compounds because flattering metrics are usually the first ones a tool shows you. Page views, sessions and total users sit on the default dashboard. Asking a sharper question (of the people who signed up in March, how many did the thing the product is for, and how many are still doing it) takes work, and the answer is often uncomfortable.
A number that cannot go down cannot tell you that something is wrong.
There is a quieter cost, too. A growing total hides a shrinking rate. If sign-ups double while the share of people who come back falls by half, the cumulative chart still climbs, and it keeps climbing right up to the month the paid traffic stops.
How they bend decisions
The damage is rarely one bad call. It is a slow bias in what gets funded. Acquisition work shows up on the flattering chart within days; retention work shows up months later, on a chart nobody looks at. So acquisition wins the argument every quarter, and the product fills up with customers it cannot keep.
Experiments suffer the same way. A test judged on clicks or sign-ups can declare a winner that costs you revenue or customers further down the line. That is why an A/B test needs a guardrail you are not willing to trade away, and why its primary metric should be one that can fall.
Onboarding is the classic case. A completion rate looks like progress, but finishing a tour is not the same as understanding the product. One team found that an onboarding fewer people completed kept more of them, and stopped reporting completion as a headline number.
What to watch instead
Prefer rates to totals, cohorts to aggregates and behaviors to visits. The share of new customers who reach the first valuable action in a week. The retention of this month’s cohort against last month’s. Revenue per active customer. These numbers fall when things go wrong, which is exactly what makes them useful.
None of this is new. Researchers at Google proposed the HEART framework to tie product metrics back to user goals rather than raw traffic, and the UK government’s service manual tells teams to start from what the service is for and pick a handful of measures that say whether it is working. The method is the same in both: name the outcome, find the behavior that signals it, then measure that behavior.
In practice, every headline number on a dashboard should pass a simple test. Could it go down? If it went down, would anyone do something differently? If the answer to either question is no, the number is decoration.
When the honest number is bad news
The honest metrics are less pleasant to present. A cohort chart that keeps sloping toward zero is a hard slide to show a board. But it is the slide that tells you where to work, and it is the only one that will show improvement when the work pays off. A habit changes the shape of the retention curve, and a paywall moved to the right moment shows up in revenue per cohort, not in total sign-ups.
That is the real argument for the unflattering numbers. They are not more virtuous. They are simply the only ones that can tell you whether anything you did made a difference.
Keep the flattering charts if they cheer the team up. Just don’t let them anywhere near a decision.
Keep reading
View all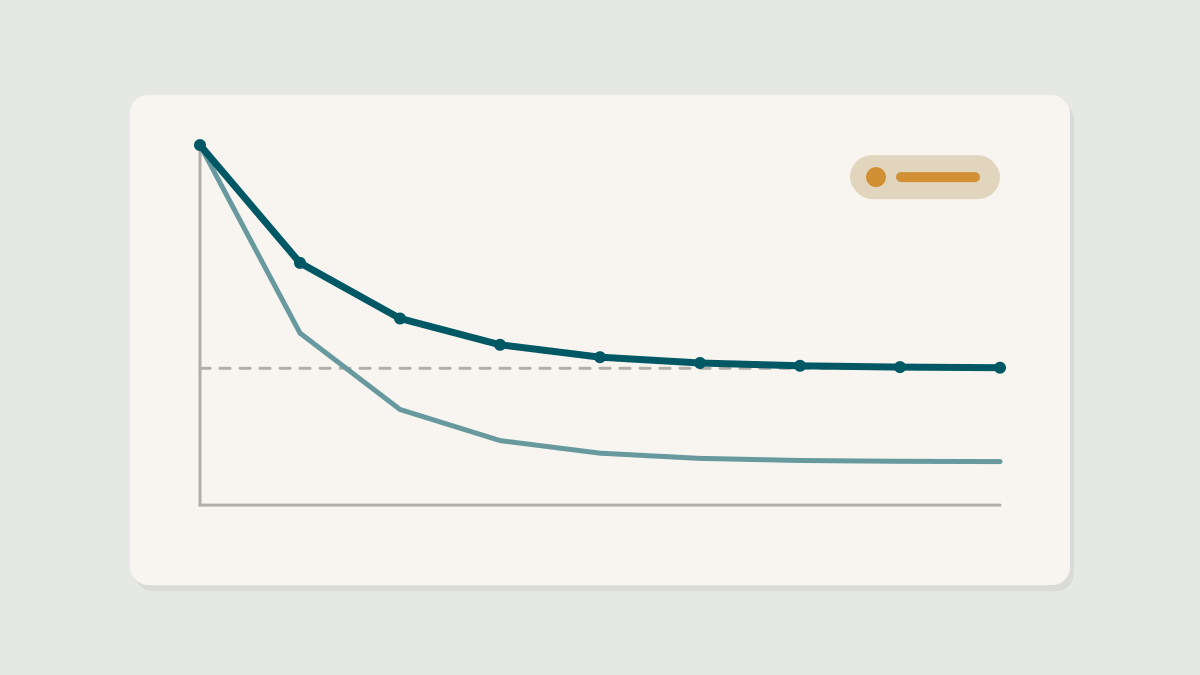


For pitches, data you would like us to look at and letters to the editor, write to us any time. We read everything.
Free. One study, one teardown and one thing to test, every Tuesday morning. Nothing else.