Retention curves, explained
What it is
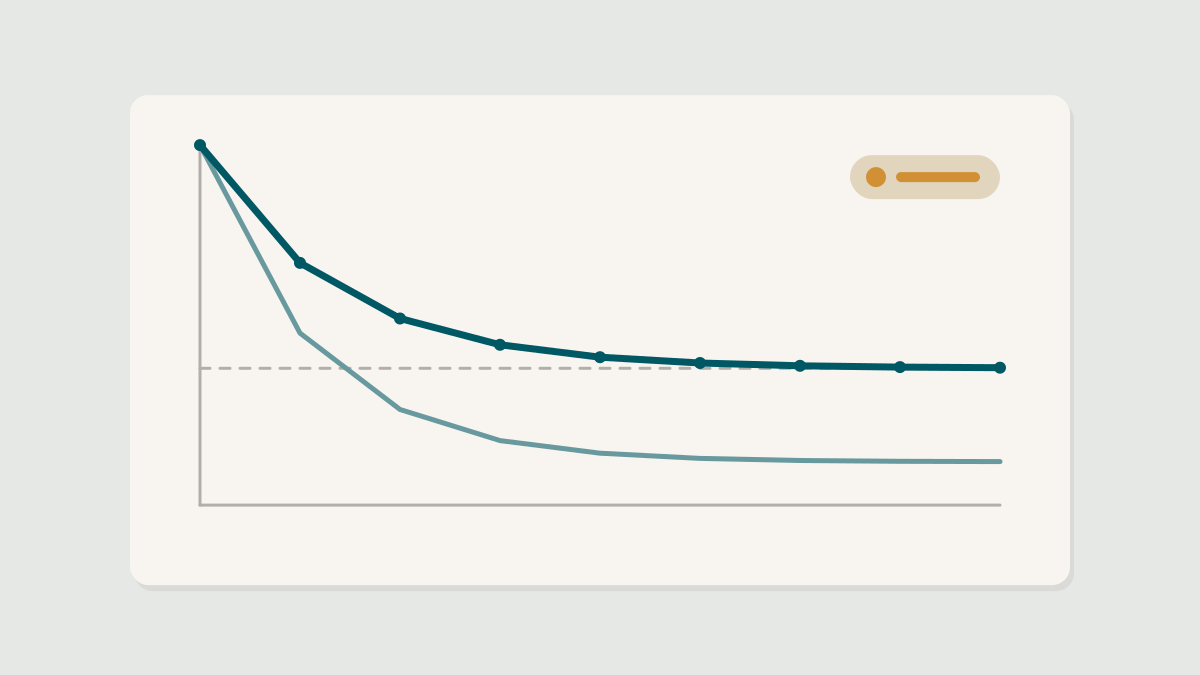
A retention curve groups customers by when they started — a cohort — and shows what share of each cohort is still active in each period afterwards. Week zero is always one hundred percent. Every point after that answers one question: of the people who started then, how many are still here now?
Reading the shape
Almost every curve falls steeply at first. The question that matters is whether it flattens. A curve that levels off means some share of customers has found lasting value; the height of that plateau is the size of your retained base. A curve that keeps falling toward zero means the product has not yet found a group of customers who need it repeatedly, however good the acquisition numbers look.
| Shape | What it usually means | Where to look next |
|---|---|---|
| Steep drop, then flat | A core of retained customers | Raise the plateau: activation and early habit |
| Steady decline to zero | No durable value yet | Who stays longest, and why |
| Flat, then rising | Customers returning or expanding | Which behavior predicts the return |
| Newer cohorts higher | Recent changes are working | Confirm the cause before you scale it |
Defining active
The curve is only as honest as your definition of active. Logging in is a weak definition; a customer can open the app, see nothing useful and leave. Choose the action that represents value — sending an invoice, completing a lesson, placing an order — and count that.
Choose the period to match natural use, too. A daily-use messaging tool should be measured by day or week; an accounting product used at month end needs a monthly curve, or it will look like it is failing every week.
The averaging trap
A single blended retention number across all customers hides everything. Mixing old, loyal cohorts with new ones makes retention look stable while each new cohort is doing worse. Always compare cohorts side by side.
Common mistakes
Reading the right-hand edge of young cohorts as if it were final. Comparing cohorts acquired through very different channels without separating them. And celebrating a lift in week one that disappears by week six — the classic signature of a campaign, not a change in behavior.
How many customers do I need in a cohort?
What is a good retention rate?
Keep reading
View all

For pitches, data you would like us to look at and letters to the editor, write to us any time. We read everything.
Free. One study, one teardown and one thing to test, every Tuesday morning. Nothing else.