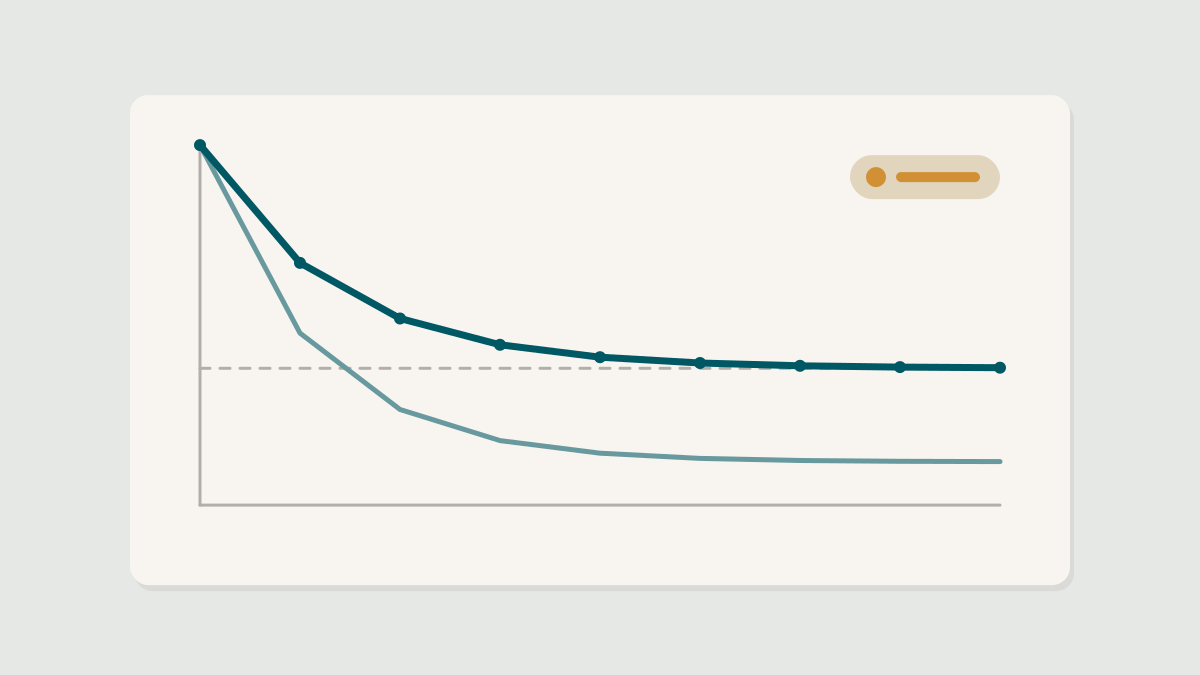
Retention curves, explained
The single most useful chart in product analytics is also one of the most misread. How to build a retention curve, what its shape tells you and the mistakes that make it lie.
The single most useful chart in product analytics is also one of the most misread. How to build a retention curve, what its shape tells you and the mistakes that make it lie.

A green result on the dashboard is not the same as a true one. The most common ways experiments mislead product teams, and how to guard against each.