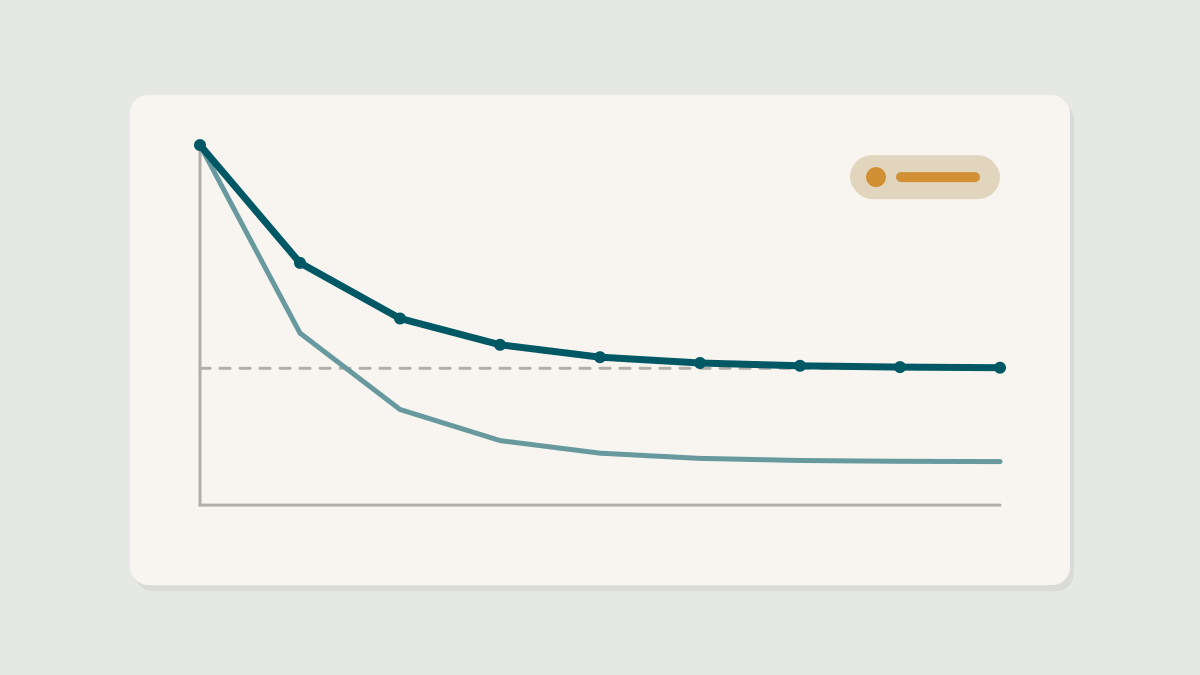
Retention curves, explained
The single most useful chart in product analytics is also one of the most misread. How to build a retention curve, what its shape tells you and the mistakes that make it lie.
Cohorts, funnels and experiments: reading product data honestly, including the numbers that flatter you.
3 articles
The single most useful chart in product analytics is also one of the most misread. How to build a retention curve, what its shape tells you and the mistakes that make it lie.
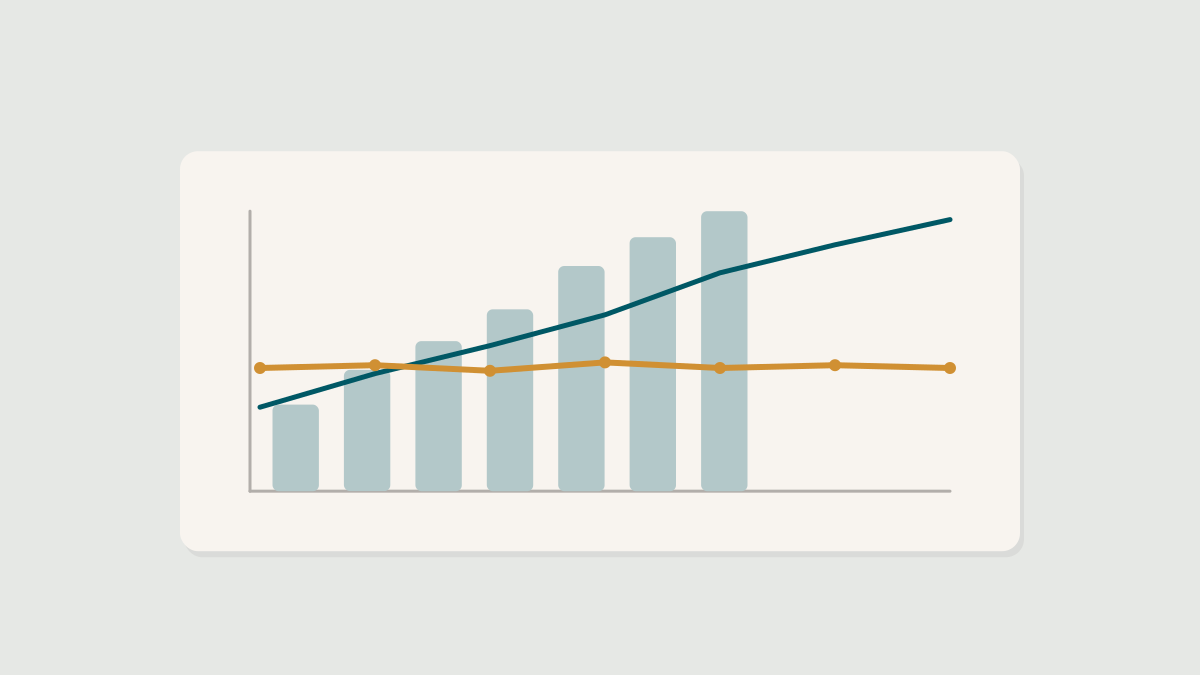
Sign-ups, page views and total users all go up and to the right. That is exactly why they are so dangerous to run a product on.

A green result on the dashboard is not the same as a true one. The most common ways experiments mislead product teams, and how to guard against each.
Recent searches
No results found
Search is temporarily unavailable. Please check your connection and try again.